
If you live with multiple sclerosis, you know the monitoring routine: MRI scans, neurological examinations, symptom check-ins. Those remain the backbone of MS care. In the last few years a blood test has joined them. Your neurologist may have mentioned "NfL", or you may have seen the result on a lab report and wondered what the number means and whether it is normal.
NfL is a protein that leaks from damaged nerve fibers into the blood, so it shows how much nerve injury is happening now. One high result is a reason to look closer alongside your MRI, not a diagnosis.
What is neurofilament light chain?
NfL stands for neurofilament light chain, sometimes written NF-L. Neurofilaments are structural proteins inside nerve cells, the scaffolding that gives axons, the long cable-like extensions of neurons, their shape and supports signal transport along them. The light chain is the smallest of the neurofilament subunits and the one that is easiest to measure.
When nerve cells are injured, whether by inflammation, demyelination, or degeneration, that scaffolding breaks apart and NfL leaks out. It enters the cerebrospinal fluid surrounding the brain and spinal cord first, and a small fraction crosses into the bloodstream. The principle is simple: more nerve damage, more NfL in the blood.
NfL is not specific to MS. It rises with any injury to nerve cells, from head trauma to neuropathy to neurodegenerative disease. What makes it useful in MS is that it changes quickly, it falls when inflammation is controlled, and it can now be measured from a routine blood sample rather than a spinal tap.
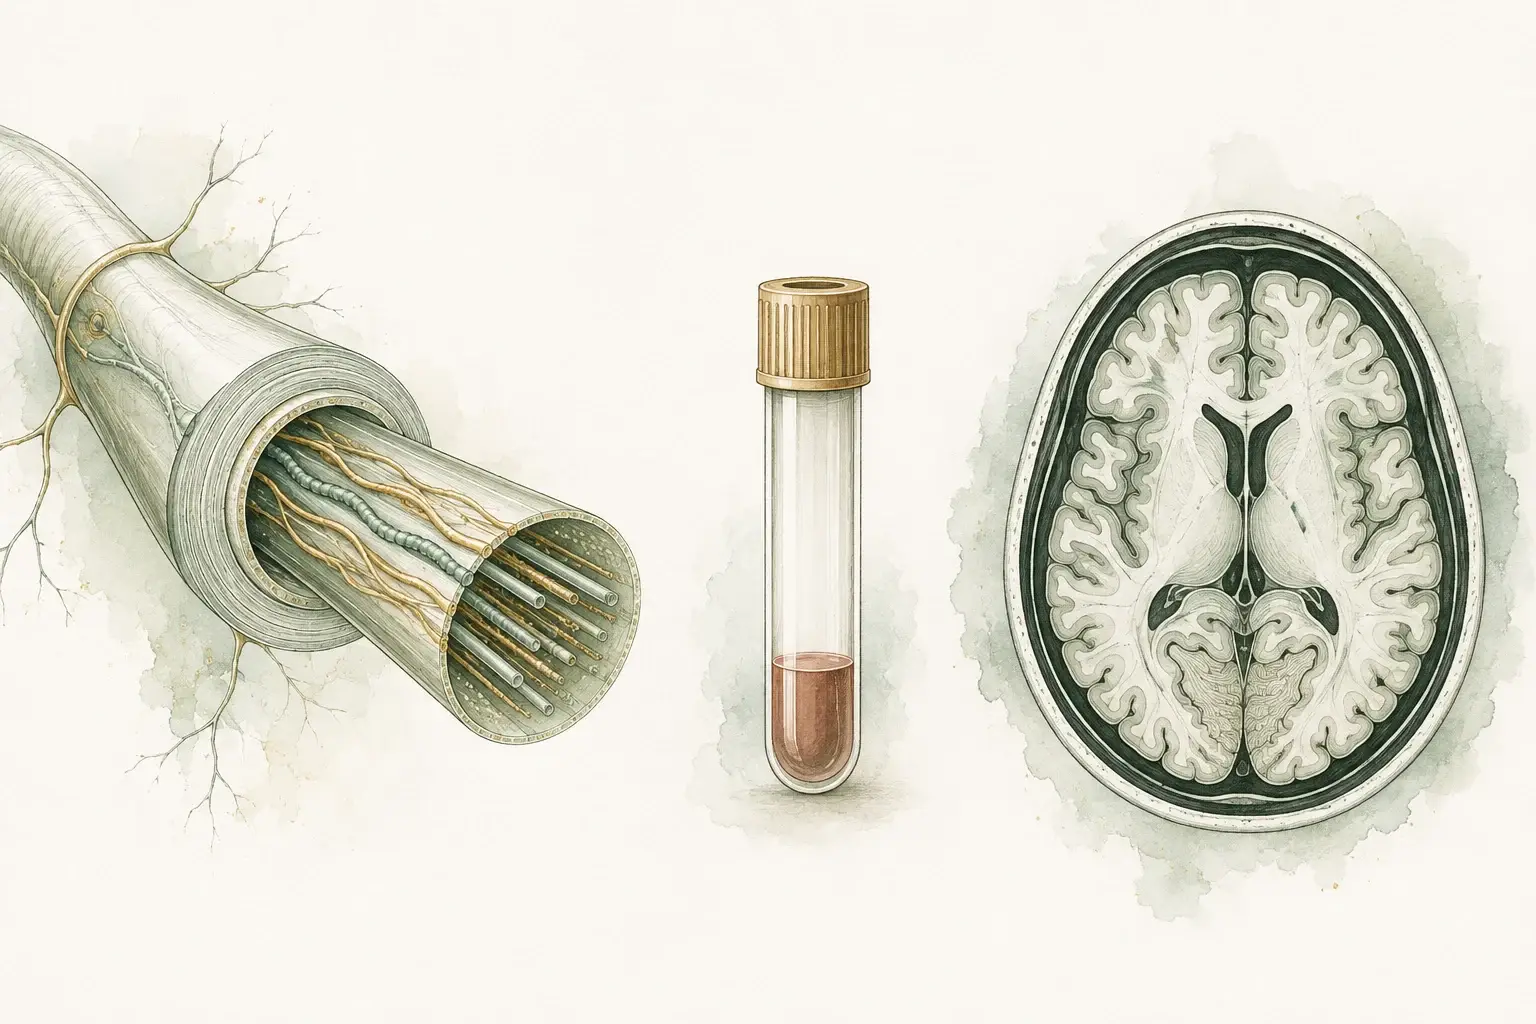
A blood marker adds another view
- What is measured: NfL is a protein from nerve fibers that can enter blood after nerve injury.
- Context matters: Age and changes across repeated tests help give a result meaning.
- One part of monitoring: NfL does not diagnose MS on its own.
Why NfL matters in MS
MRI is the standard for monitoring MS, and it will remain so. But MRI has blind spots. It shows structural change, meaning white matter lesions, contrast enhancement, and brain volume, at the moment of the scan. It does not show everything happening at the cellular level, and it is usually done once a year. NfL fills some of that gap.
- Activity between scans. NfL can rise when nerve damage is happening even though the last MRI looked stable and there has been no relapse, giving an earlier signal of neuroinflammation.
- Treatment response. After a disease-modifying therapy starts or changes, NfL typically falls if the medication is controlling inflammation. A level that stays high suggests the current therapy may not be enough.
- Progressive MS and silent progression. When relapses are rare but slow degeneration continues, including progression independent of relapse activity inside relapsing MS, NfL offers a way to quantify ongoing damage.
- Outlook. Higher NfL levels are consistently associated with more future relapses, new lesions, brain volume loss, and disability worsening, which is why a persistently high value prompts a closer look.
The test helps most soon after you start or switch a therapy, or when your MRI is stable but you feel worse, such as more fatigue or slower thinking. It also helps when choosing between treatments, in progressive MS, before a pregnancy, or before a clinical trial. Not everyone with MS needs the test at every visit, but in these situations it can change a decision.
How the NfL blood test works
From your side, it is an ordinary blood draw: one tube, no fasting, no preparation. The sample goes to a specialized laboratory.
The technology is what makes the test possible. NfL concentrations in blood are extremely low, far below what standard laboratory assays can detect. Ultrasensitive tests developed over the past decade can measure proteins at those concentrations reliably, which is what moved NfL from a research measurement in spinal fluid, obtained by lumbar puncture, to a routine blood test. Several commercial laboratories now offer it, results usually take one to two weeks, and the report gives a concentration along with a comparison to people of similar age.
What your NfL results mean
Is there a normal range for the NfL blood test?
Not a single one, and this is the most common source of confusion. NfL rises naturally with age even in perfectly healthy people, because a small amount of nerve cell turnover is normal and increases over the decades. A value that is unremarkable at 65 can be clearly elevated at 30. Body weight shifts it a little. Kidney function matters considerably more: reduced kidney clearance can raise NfL as much as age does.
For that reason, laboratories and neurologists do not use one cutoff. Most laboratories report your value against a reference range for your age group. MS-focused platforms go further, converting it into a percentile or z-score adjusted for both age and body mass index: how far above or below the expected value for someone like you it falls. Different laboratories use different assays and different reference populations, so a number from one lab is not directly comparable with a number from another. The practical answer to "is my NfL normal" is therefore always relative: normal for your age, on this assay, compared with your own previous results.
The largest reference study shows why. Researchers measured NfL in 10,133 blood samples from 5,390 people without a neurological disease and built percentiles adjusted for age and body mass index, then reported each result as a z-score: how far a value sits from what is expected for someone like you. Levels rose steeply after about age 50. In people with MS, a z-score above 1.5 was associated with roughly three times the odds of clinical or MRI disease activity in the following period (odds ratio 3.15), and the z-score outperformed any raw cutoff. That makes a high z-score a prompt to look closer, not a diagnosis and not a verdict.
Because each laboratory and assay has its own normal range, the most useful number on your report is the age-adjusted z-score or percentile, when it is given (reference 8):
| Z-score | Roughly the percentile | What it usually means |
|---|---|---|
| Around 0 | Around the 50th | Typical for your age and body mass index |
| 1.5 or higher | About the 93rd or higher | Usually read as elevated: a reason to look more closely |
| 2 or higher | About the 98th or higher | Clearly elevated |
The pattern is what matters
A single measurement is a snapshot. The value of NfL comes from establishing a baseline and watching how it moves.
| Pattern | What it may suggest | What usually follows |
|---|---|---|
| Normal for age and stable | No significant ongoing nerve damage | Continue the current plan |
| High at baseline | Active disease, a recent relapse, or treatment that is not sufficient | Review alongside MRI; consider whether therapy should change |
| Falling after a treatment change | The new therapy is reducing nerve damage | Encouraging; keep monitoring |
| Rising over time | Increasing disease activity or progression | Correlate with MRI and examination; discuss adjusting treatment |
| A single spike | A recent relapse, an infection, a minor head injury, or laboratory variation | Repeat the test after an interval before acting |
A high NfL is not a diagnosis and a low one is not a guarantee. Your neurologist reads the result together with your MRI, your examination, your symptoms, and the course of your disease, and a decision is rarely made on NfL alone.
How to read your NfL report
Reports differ between laboratories, but most show some version of these three lines. The numbers in this example are an illustration, not a reference value.
| Line on the report | Example | What it tells you |
|---|---|---|
| NfL concentration | 12.0 pg/mL | The amount in your blood, in picograms per milliliter. On its own it says little, because what is typical depends on your age and the assay. |
| Percentile | 96th | Your value is higher than 96 of 100 people of your age without a neurological disease, measured on the same assay. |
| Z-score | 1.8 | How far your value sits above the expected value, in standard deviations. Zero is typical; above 1.5 is usually read as elevated and above 2 as clearly elevated (reference 8). |
When you compare two results, a change of less than about a quarter can be ordinary test-to-test variation (reference 8). A result like the example is a reason to ask the questions below, not a verdict.
Three questions to ask about your result
- Was it reported as an age-adjusted z-score or percentile, or only as a raw number? A raw value without a reference is hard to interpret at any age.
- What was my previous value on the same assay? The trend carries the information, and numbers from different laboratories are not interchangeable.
- If it is high, what else could explain a rise before we change anything? A recent relapse, an infection, a knock to the head, or kidney function can all move it.
NfL and treatment decisions
The most practical use of the test is answering the question everyone on a disease-modifying therapy asks: is this working? The logic is direct. Effective treatment reduces inflammation, which reduces nerve damage, which lowers NfL.
Measured before a new therapy begins and again some months into it, on a schedule your neurologist sets, a fall into the range expected for your age is good evidence that the medication is working at the biological level, often before the next MRI is due. A level that stays high or climbs despite treatment is a signal to look harder: repeat imaging, check adherence, and consider whether a more effective option, such as one of the B-cell therapies, would serve you better.
The test also offers reassurance in the other direction. Many people worry quietly about whether their medication is doing anything, particularly when they feel no different day to day. Seeing NfL fall and stay low is concrete evidence of protection, and for some people that changes how they feel about staying on treatment.
NfL vs MRI: complementary tools
NfL does not replace MRI. They answer different questions and are strongest together.
| NfL blood test | Brain and spinal cord MRI | |
|---|---|---|
| What it measures | Active nerve injury right now, anywhere in the nervous system | Structural change: lesions, enhancement, atrophy |
| Sensitivity to hidden activity | High; can rise before a lesion is visible | Moderate; may miss diffuse or very recent damage |
| Specificity to MS | Low; raised by many conditions | High; lesion patterns are characteristic |
| Location information | None | Precise |
| Frequency | Easy to repeat with routine blood work | Usually yearly, more often if needed |
| Burden | A blood draw | Scanner time, sometimes contrast, scheduling |
| Best for | Tracking biological activity between scans and after treatment changes | Diagnosis, locating lesions, measuring brain volume |
Understanding your MS brain MRI remains essential for diagnosis under the McDonald criteria and for tracking structural change. NfL adds a biological signal the scan cannot give: whether nerve damage is happening now.

Use a trend with the right context
- Repeated measurements: Changes over time can be more useful than one isolated value.
- Age context: Results are interpreted against age-appropriate reference information.
- Complementary tools: NfL adds information and does not replace imaging or clinical assessment.
Limitations of the NfL test
It is worth being clear about what NfL cannot do.
- It cannot diagnose MS. Any process that injures nerve cells raises it, including other neurological diseases, head injury, peripheral neuropathy, stroke, and aging. Chronic kidney disease, diabetes, and pregnancy can raise it too, for reasons that have nothing to do with MS. A high NfL on its own does not mean MS, and a normal NfL does not exclude it.
- There is no universal cutoff. Assays and reference populations differ between laboratories, and no single threshold separates "active" from "stable" disease. Your own trend is more informative than any one value.
- Age and other conditions complicate interpretation. In older people, in people with diabetic neuropathy, or in anyone with a second neurological condition, the MS contribution to the number is harder to isolate.
- It is still maturing. The research base is large and growing, but guidelines are still catching up. Not every neurologist orders it, and insurance coverage is inconsistent.
NfL and GFAP
A second blood marker, glial fibrillary acidic protein (GFAP), comes from astrocytes, the support cells of the brain and spinal cord, rather than from nerve fibers. NfL rises most with active inflammation, such as a relapse or new lesions, while GFAP appears to track the slower process behind progression. In a 2023 study, GFAP was higher in people whose disability was worsening without relapses, and people with both markers raised had about four to five times the risk of later worsening (reference 9). GFAP testing is newer than NfL, so for now the two are mostly measured together at MS centers and in research.
Talking it through
If you want to know whether NfL testing would add something to your monitoring, whether a result you already have is meaningful, or whether it should be part of a decision about changing treatment, bring it to your neurologist along with your most recent MRI. At a multiple sclerosis evaluation, the blood test is ordered as part of routine labs and interpreted alongside your actual MRI images and examination. Feeling no different on treatment can leave you wondering if it works. In a 60-minute first visit, Dr. Achillefs Ntranos explains in plain language what your results show. Follow-ups are usually every one to three months and last 30 to 45 minutes. Request a visit in Beverly Hills or Los Angeles, or by video anywhere in California. No referral is needed; the office confirms within 1 business day.
Frequently asked questions
References
- Ning L, Wang B. Neurofilament light chain in blood as a diagnostic and predictive biomarker for multiple sclerosis: a systematic review and meta-analysis. PLoS One, 2022.
- Benkert P, et al. Serum neurofilament light chain for individual prognostication of disease activity in people with multiple sclerosis: a retrospective modelling and validation study. The Lancet Neurology, 2022.
- Kuhle J, et al. Blood neurofilament light chain as a biomarker of MS disease activity and treatment response. Neurology, 2019.
- Disanto G, et al. Serum neurofilament light: a biomarker of neuronal damage in multiple sclerosis. Annals of Neurology, 2017.
- National Multiple Sclerosis Society. Disease-modifying therapies for MS.
- Polymeris AA, et al. Renal function and body mass index contribute to serum neurofilament light chain levels in elderly patients with atrial fibrillation. Frontiers in Neuroscience, 2022.
- Abdelhak A, et al. Serum neurofilament light chain reference database for individual application in paediatric care: a retrospective modelling and validation study. The Lancet Neurology, 2023.
- Association for Diagnostics and Laboratory Medicine. Neurofilament light chain assays for MS, 2026.
- Meier S, et al. Serum glial fibrillary acidic protein compared with neurofilament light chain as a biomarker for disease progression in multiple sclerosis. JAMA Neurology, 2023.